pi038
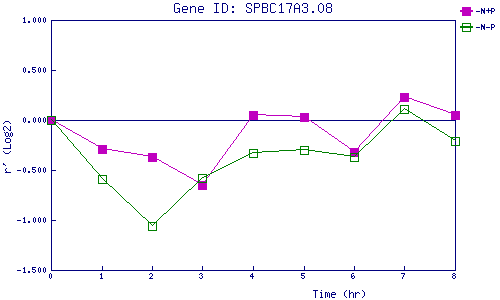
| 0 | 1 | 2 | 3 | 4 | 5 | 6 | 7 | 8 | |
| -N+P | 0.000 | -0.287 | -0.373 | -0.653 | 0.050 | 0.026 | -0.318 | 0.232 | 0.053 |
| -N-P | 0.000 | -0.588 | -1.065 | -0.578 | -0.326 | -0.304 | -0.366 | 0.108 | -0.209 |
|
-N+P: Nitrogen starved in the presence of P-factor -N-P: Nitrogen starved in the absence of P-factor |