pi037
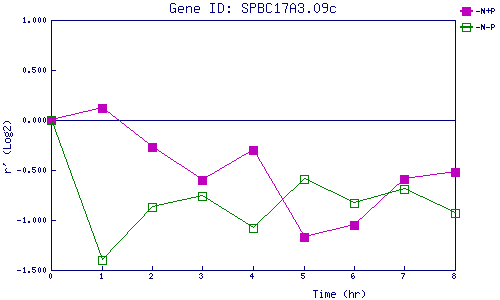
| 0 | 1 | 2 | 3 | 4 | 5 | 6 | 7 | 8 | |
| -N+P | 0.000 | 0.124 | -0.272 | -0.605 | -0.296 | -1.171 | -1.049 | -0.592 | -0.522 |
| -N-P | 0.000 | -1.405 | -0.866 | -0.760 | -1.080 | -0.586 | -0.827 | -0.691 | -0.934 |
|
-N+P: Nitrogen starved in the presence of P-factor -N-P: Nitrogen starved in the absence of P-factor |