pi036
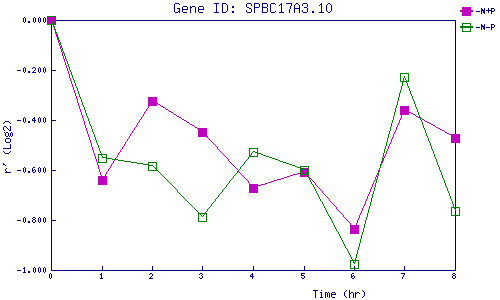
| 0 | 1 | 2 | 3 | 4 | 5 | 6 | 7 | 8 | |
| -N+P | 0.000 | -0.638 | -0.323 | -0.448 | -0.671 | -0.609 | -0.837 | -0.358 | -0.470 |
| -N-P | 0.000 | -0.553 | -0.585 | -0.789 | -0.530 | -0.599 | -0.977 | -0.228 | -0.764 |
|
-N+P: Nitrogen starved in the presence of P-factor -N-P: Nitrogen starved in the absence of P-factor |