| 0 | 1 | 2 | 3 | 4 | 5 | 6 | 7 | 8 | |
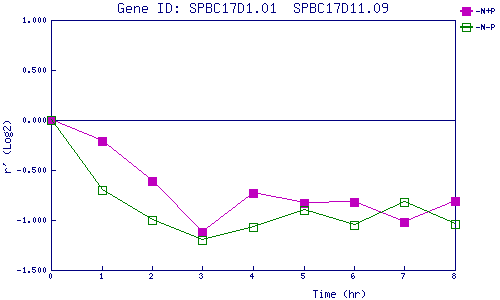
| -N+P | 0.000 | -0.214 | -0.613 | -1.115 | -0.730 | -0.828 | -0.820 | -1.018 | -0.807 |
| -N-P | 0.000 | -0.695 | -0.997 | -1.203 | -1.072 | -0.896 | -1.053 | -0.816 | -1.039 |
|
-N+P: Nitrogen starved in the presence of P-factor -N-P: Nitrogen starved in the absence of P-factor |