| 0 | 1 | 2 | 3 | 4 | 5 | 6 | 7 | 8 | |
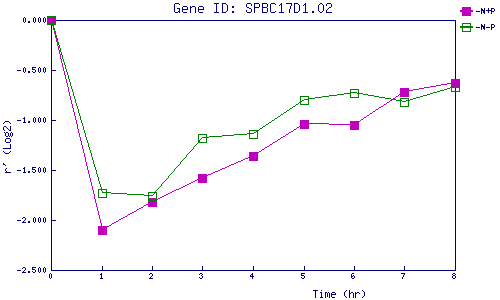
| -N+P | 0.000 | -2.105 | -1.819 | -1.579 | -1.357 | -1.043 | -1.052 | -0.715 | -0.630 |
| -N-P | 0.000 | -1.735 | -1.757 | -1.183 | -1.145 | -0.804 | -0.732 | -0.823 | -0.674 |
|
-N+P: Nitrogen starved in the presence of P-factor -N-P: Nitrogen starved in the absence of P-factor |