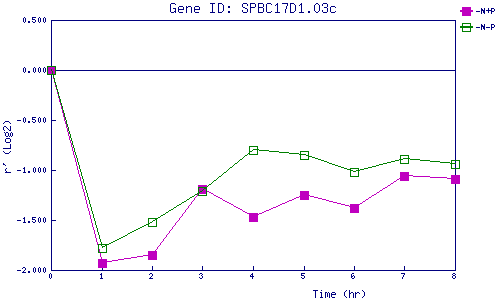
| 0 | 1 | 2 | 3 | 4 | 5 | 6 | 7 | 8 | |
| -N+P | 0.000 | -1.934 | -1.850 | -1.193 | -1.474 | -1.251 | -1.375 | -1.062 | -1.092 |
| -N-P | 0.000 | -1.785 | -1.515 | -1.214 | -0.798 | -0.854 | -1.023 | -0.892 | -0.937 |
|
-N+P: Nitrogen starved in the presence of P-factor -N-P: Nitrogen starved in the absence of P-factor |