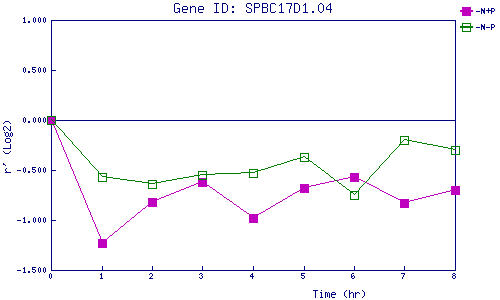
| 0 | 1 | 2 | 3 | 4 | 5 | 6 | 7 | 8 | |
| -N+P | 0.000 | -1.227 | -0.822 | -0.615 | -0.975 | -0.680 | -0.567 | -0.831 | -0.697 |
| -N-P | 0.000 | -0.567 | -0.636 | -0.547 | -0.528 | -0.366 | -0.748 | -0.202 | -0.305 |
|
-N+P: Nitrogen starved in the presence of P-factor -N-P: Nitrogen starved in the absence of P-factor |