| 0 | 1 | 2 | 3 | 4 | 5 | 6 | 7 | 8 | |
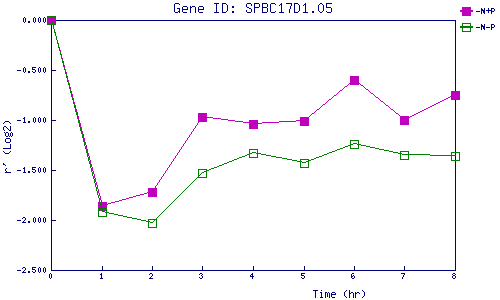
| -N+P | 0.000 | -1.859 | -1.720 | -0.966 | -1.042 | -1.015 | -0.601 | -1.002 | -0.747 |
| -N-P | 0.000 | -1.921 | -2.027 | -1.534 | -1.334 | -1.434 | -1.240 | -1.348 | -1.357 |
|
-N+P: Nitrogen starved in the presence of P-factor -N-P: Nitrogen starved in the absence of P-factor |