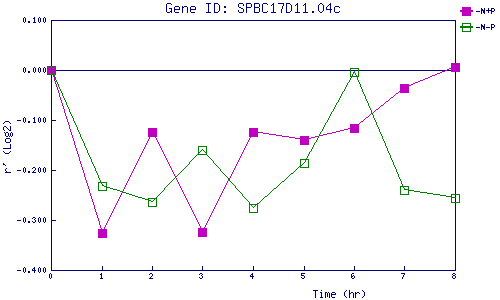
| 0 | 1 | 2 | 3 | 4 | 5 | 6 | 7 | 8 | |
| -N+P | 0.000 | -0.326 | -0.125 | -0.324 | -0.124 | -0.140 | -0.117 | -0.035 | 0.006 |
| -N-P | 0.000 | -0.232 | -0.264 | -0.159 | -0.276 | -0.186 | -0.003 | -0.241 | -0.256 |
|
-N+P: Nitrogen starved in the presence of P-factor -N-P: Nitrogen starved in the absence of P-factor |