spp2 pri2
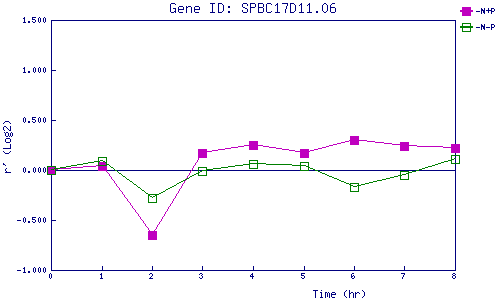
| 0 | 1 | 2 | 3 | 4 | 5 | 6 | 7 | 8 | |
| -N+P | 0.000 | 0.041 | -0.652 | 0.170 | 0.249 | 0.174 | 0.302 | 0.243 | 0.225 |
| -N-P | 0.000 | 0.091 | -0.284 | -0.008 | 0.063 | 0.045 | -0.173 | -0.048 | 0.106 |
|
-N+P: Nitrogen starved in the presence of P-factor -N-P: Nitrogen starved in the absence of P-factor |