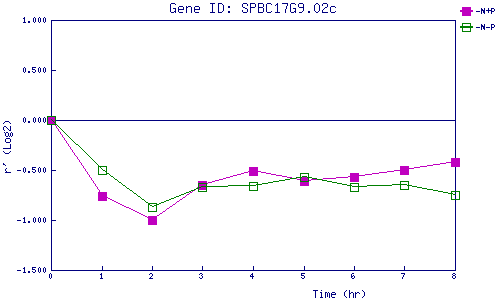
| 0 | 1 | 2 | 3 | 4 | 5 | 6 | 7 | 8 | |
| -N+P | 0.000 | -0.759 | -1.005 | -0.647 | -0.514 | -0.613 | -0.574 | -0.501 | -0.415 |
| -N-P | 0.000 | -0.498 | -0.874 | -0.669 | -0.662 | -0.572 | -0.666 | -0.649 | -0.752 |
|
-N+P: Nitrogen starved in the presence of P-factor -N-P: Nitrogen starved in the absence of P-factor |