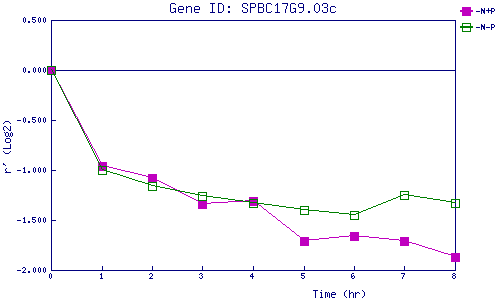
| 0 | 1 | 2 | 3 | 4 | 5 | 6 | 7 | 8 | |
| -N+P | 0.000 | -0.956 | -1.076 | -1.338 | -1.309 | -1.715 | -1.655 | -1.706 | -1.870 |
| -N-P | 0.000 | -1.001 | -1.165 | -1.262 | -1.327 | -1.401 | -1.451 | -1.248 | -1.329 |
|
-N+P: Nitrogen starved in the presence of P-factor -N-P: Nitrogen starved in the absence of P-factor |