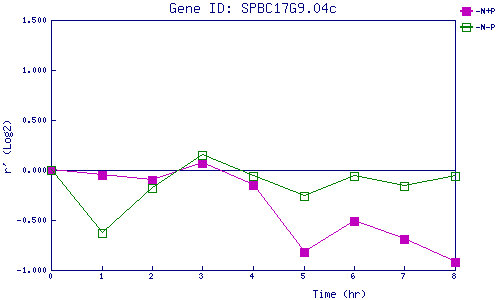
| 0 | 1 | 2 | 3 | 4 | 5 | 6 | 7 | 8 | |
| -N+P | 0.000 | -0.048 | -0.102 | 0.066 | -0.150 | -0.820 | -0.509 | -0.693 | -0.924 |
| -N-P | 0.000 | -0.626 | -0.177 | 0.152 | -0.061 | -0.259 | -0.062 | -0.160 | -0.065 |
|
-N+P: Nitrogen starved in the presence of P-factor -N-P: Nitrogen starved in the absence of P-factor |