tif213
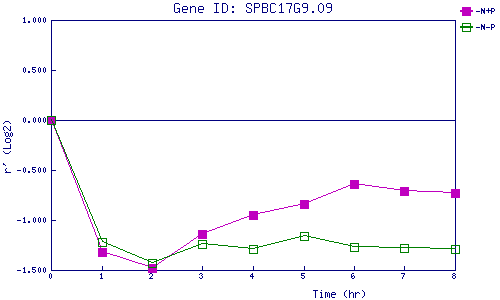
| 0 | 1 | 2 | 3 | 4 | 5 | 6 | 7 | 8 | |
| -N+P | 0.000 | -1.318 | -1.481 | -1.141 | -0.946 | -0.839 | -0.639 | -0.706 | -0.729 |
| -N-P | 0.000 | -1.218 | -1.433 | -1.242 | -1.289 | -1.160 | -1.271 | -1.275 | -1.289 |
|
-N+P: Nitrogen starved in the presence of P-factor -N-P: Nitrogen starved in the absence of P-factor |