rpl11-2 rpl1102
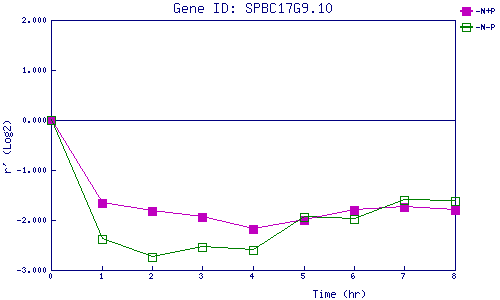
| 0 | 1 | 2 | 3 | 4 | 5 | 6 | 7 | 8 | |
| -N+P | 0.000 | -1.658 | -1.814 | -1.931 | -2.187 | -1.993 | -1.799 | -1.737 | -1.807 |
| -N-P | 0.000 | -2.387 | -2.748 | -2.536 | -2.593 | -1.947 | -1.981 | -1.598 | -1.624 |
|
-N+P: Nitrogen starved in the presence of P-factor -N-P: Nitrogen starved in the absence of P-factor |