eno1
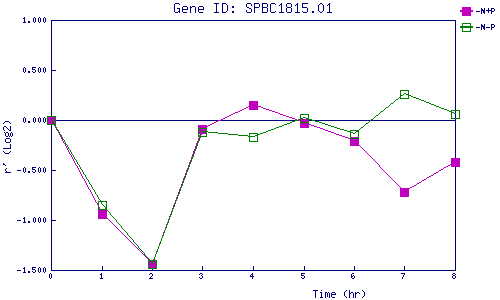
| 0 | 1 | 2 | 3 | 4 | 5 | 6 | 7 | 8 | |
| -N+P | 0.000 | -0.941 | -1.444 | -0.086 | 0.152 | -0.026 | -0.212 | -0.719 | -0.419 |
| -N-P | 0.000 | -0.846 | -1.436 | -0.124 | -0.167 | 0.018 | -0.135 | 0.258 | 0.056 |
|
-N+P: Nitrogen starved in the presence of P-factor -N-P: Nitrogen starved in the absence of P-factor |