abp2
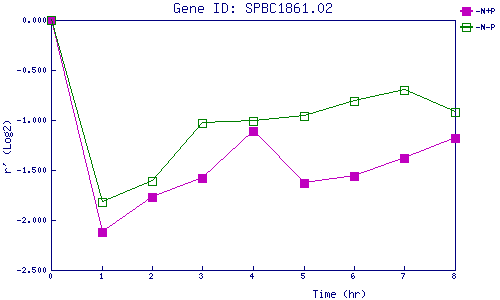
| 0 | 1 | 2 | 3 | 4 | 5 | 6 | 7 | 8 | |
| -N+P | 0.000 | -2.117 | -1.771 | -1.577 | -1.106 | -1.630 | -1.563 | -1.376 | -1.178 |
| -N-P | 0.000 | -1.823 | -1.612 | -1.030 | -1.012 | -0.958 | -0.813 | -0.705 | -0.916 |
|
-N+P: Nitrogen starved in the presence of P-factor -N-P: Nitrogen starved in the absence of P-factor |