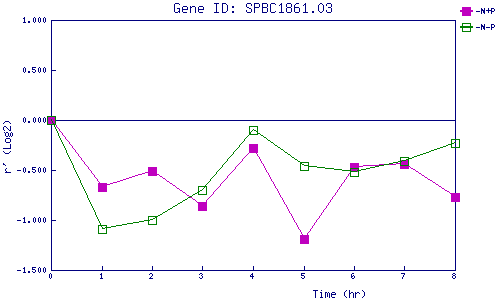
| 0 | 1 | 2 | 3 | 4 | 5 | 6 | 7 | 8 | |
| -N+P | 0.000 | -0.669 | -0.511 | -0.865 | -0.281 | -1.187 | -0.472 | -0.444 | -0.768 |
| -N-P | 0.000 | -1.086 | -0.997 | -0.695 | -0.095 | -0.463 | -0.515 | -0.411 | -0.226 |
|
-N+P: Nitrogen starved in the presence of P-factor -N-P: Nitrogen starved in the absence of P-factor |