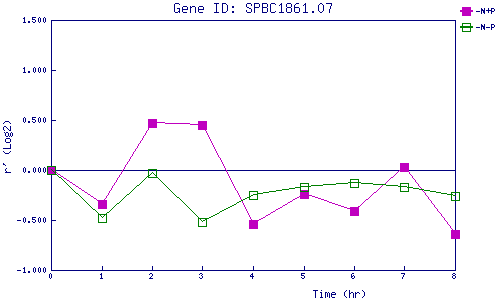
| 0 | 1 | 2 | 3 | 4 | 5 | 6 | 7 | 8 | |
| -N+P | 0.000 | -0.340 | 0.467 | 0.446 | -0.542 | -0.243 | -0.407 | 0.026 | -0.638 |
| -N-P | 0.000 | -0.479 | -0.029 | -0.517 | -0.247 | -0.173 | -0.129 | -0.169 | -0.261 |
|
-N+P: Nitrogen starved in the presence of P-factor -N-P: Nitrogen starved in the absence of P-factor |