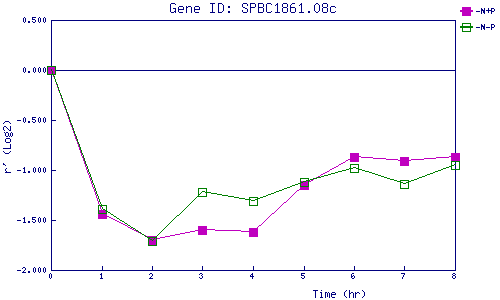
| 0 | 1 | 2 | 3 | 4 | 5 | 6 | 7 | 8 | |
| -N+P | 0.000 | -1.437 | -1.698 | -1.605 | -1.616 | -1.151 | -0.873 | -0.906 | -0.866 |
| -N-P | 0.000 | -1.392 | -1.713 | -1.217 | -1.312 | -1.115 | -0.982 | -1.141 | -0.946 |
|
-N+P: Nitrogen starved in the presence of P-factor -N-P: Nitrogen starved in the absence of P-factor |