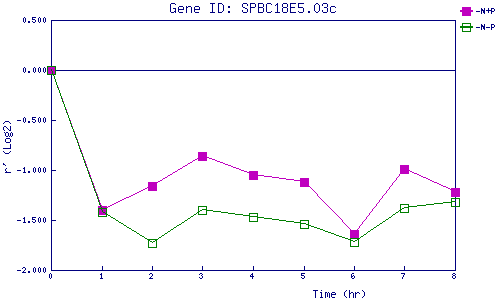
| 0 | 1 | 2 | 3 | 4 | 5 | 6 | 7 | 8 | |
| -N+P | 0.000 | -1.400 | -1.156 | -0.865 | -1.047 | -1.121 | -1.637 | -0.990 | -1.221 |
| -N-P | 0.000 | -1.417 | -1.728 | -1.398 | -1.467 | -1.535 | -1.718 | -1.379 | -1.325 |
|
-N+P: Nitrogen starved in the presence of P-factor -N-P: Nitrogen starved in the absence of P-factor |