rpl10-1 rpl1001
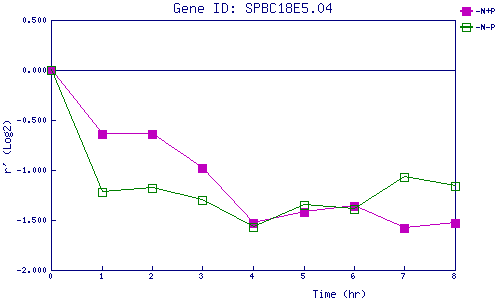
| 0 | 1 | 2 | 3 | 4 | 5 | 6 | 7 | 8 | |
| -N+P | 0.000 | -0.638 | -0.641 | -0.981 | -1.526 | -1.418 | -1.360 | -1.577 | -1.531 |
| -N-P | 0.000 | -1.218 | -1.176 | -1.304 | -1.574 | -1.347 | -1.387 | -1.070 | -1.156 |
|
-N+P: Nitrogen starved in the presence of P-factor -N-P: Nitrogen starved in the absence of P-factor |