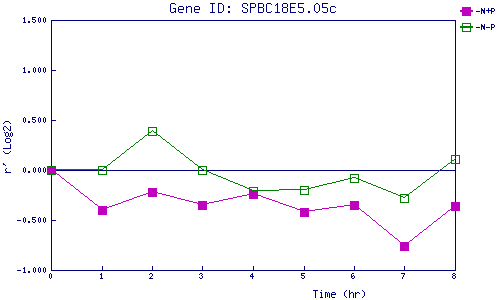
| 0 | 1 | 2 | 3 | 4 | 5 | 6 | 7 | 8 | |
| -N+P | 0.000 | -0.395 | -0.220 | -0.351 | -0.238 | -0.421 | -0.349 | -0.762 | -0.359 |
| -N-P | 0.000 | -0.005 | 0.393 | 0.000 | -0.210 | -0.195 | -0.083 | -0.279 | 0.110 |
|
-N+P: Nitrogen starved in the presence of P-factor -N-P: Nitrogen starved in the absence of P-factor |