rps21
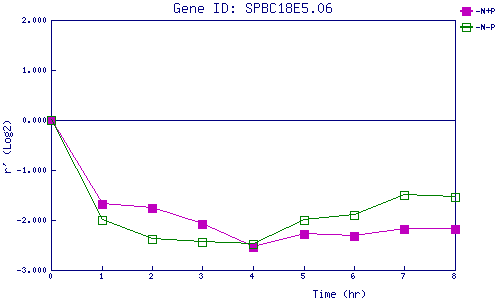
| 0 | 1 | 2 | 3 | 4 | 5 | 6 | 7 | 8 | |
| -N+P | 0.000 | -1.691 | -1.751 | -2.076 | -2.545 | -2.272 | -2.316 | -2.177 | -2.181 |
| -N-P | 0.000 | -1.998 | -2.382 | -2.438 | -2.483 | -1.991 | -1.897 | -1.497 | -1.539 |
|
-N+P: Nitrogen starved in the presence of P-factor -N-P: Nitrogen starved in the absence of P-factor |