| 0 | 1 | 2 | 3 | 4 | 5 | 6 | 7 | 8 | |
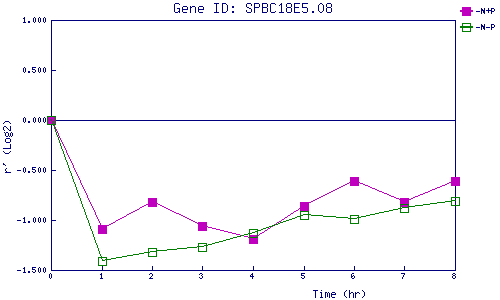
| -N+P | 0.000 | -1.086 | -0.818 | -1.059 | -1.191 | -0.865 | -0.608 | -0.823 | -0.606 |
| -N-P | 0.000 | -1.411 | -1.317 | -1.271 | -1.129 | -0.946 | -0.987 | -0.879 | -0.814 |
|
-N+P: Nitrogen starved in the presence of P-factor -N-P: Nitrogen starved in the absence of P-factor |