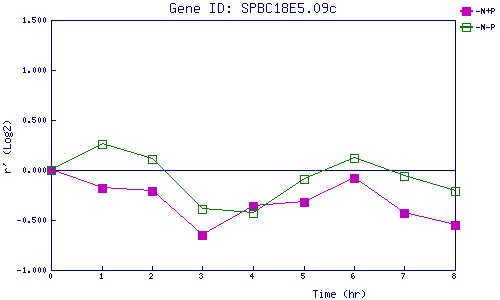
| 0 | 1 | 2 | 3 | 4 | 5 | 6 | 7 | 8 | |
| -N+P | 0.000 | -0.180 | -0.212 | -0.653 | -0.355 | -0.324 | -0.076 | -0.428 | -0.546 |
| -N-P | 0.000 | 0.255 | 0.111 | -0.392 | -0.433 | -0.090 | 0.117 | -0.063 | -0.211 |
|
-N+P: Nitrogen starved in the presence of P-factor -N-P: Nitrogen starved in the absence of P-factor |