lcf1
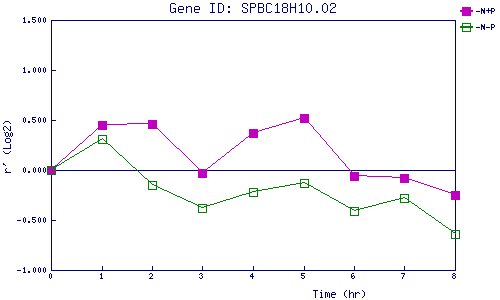
| 0 | 1 | 2 | 3 | 4 | 5 | 6 | 7 | 8 | |
| -N+P | 0.000 | 0.448 | 0.456 | -0.031 | 0.372 | 0.524 | -0.057 | -0.076 | -0.247 |
| -N-P | 0.000 | 0.313 | -0.146 | -0.383 | -0.220 | -0.133 | -0.412 | -0.276 | -0.635 |
|
-N+P: Nitrogen starved in the presence of P-factor -N-P: Nitrogen starved in the absence of P-factor |