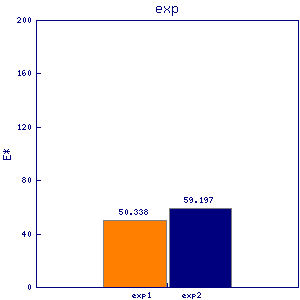
sce3 meu11
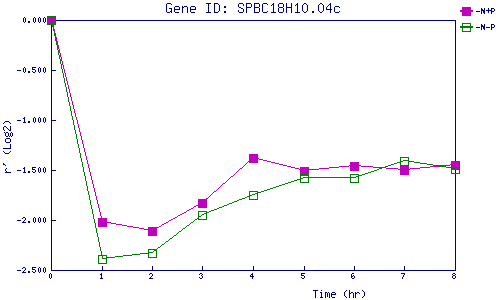
| 0 | 1 | 2 | 3 | 4 | 5 | 6 | 7 | 8 | |
| -N+P | 0.000 | -2.023 | -2.112 | -1.828 | -1.375 | -1.510 | -1.460 | -1.495 | -1.452 |
| -N-P | 0.000 | -2.388 | -2.328 | -1.951 | -1.752 | -1.582 | -1.576 | -1.410 | -1.494 |
|
-N+P: Nitrogen starved in the presence of P-factor -N-P: Nitrogen starved in the absence of P-factor |