swd2
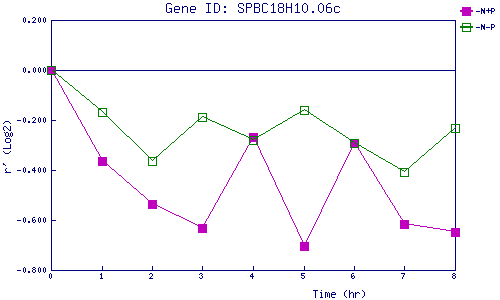
| 0 | 1 | 2 | 3 | 4 | 5 | 6 | 7 | 8 | |
| -N+P | 0.000 | -0.364 | -0.534 | -0.633 | -0.268 | -0.706 | -0.291 | -0.616 | -0.648 |
| -N-P | 0.000 | -0.167 | -0.365 | -0.188 | -0.279 | -0.162 | -0.293 | -0.407 | -0.231 |
|
-N+P: Nitrogen starved in the presence of P-factor -N-P: Nitrogen starved in the absence of P-factor |