reserved_name_ubp4
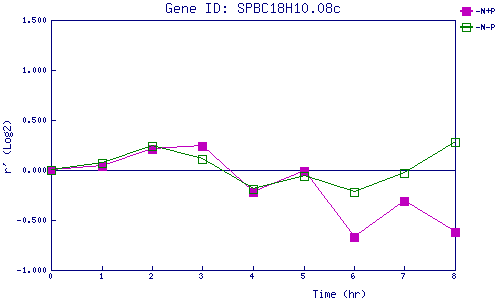
| 0 | 1 | 2 | 3 | 4 | 5 | 6 | 7 | 8 | |
| -N+P | 0.000 | 0.039 | 0.207 | 0.240 | -0.223 | -0.006 | -0.667 | -0.306 | -0.618 |
| -N-P | 0.000 | 0.073 | 0.241 | 0.107 | -0.192 | -0.058 | -0.219 | -0.034 | 0.279 |
|
-N+P: Nitrogen starved in the presence of P-factor -N-P: Nitrogen starved in the absence of P-factor |