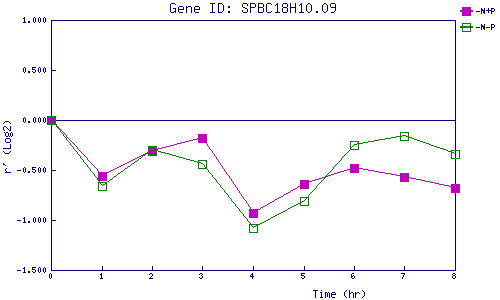
| 0 | 1 | 2 | 3 | 4 | 5 | 6 | 7 | 8 | |
| -N+P | 0.000 | -0.561 | -0.311 | -0.182 | -0.927 | -0.638 | -0.477 | -0.568 | -0.675 |
| -N-P | 0.000 | -0.658 | -0.300 | -0.438 | -1.084 | -0.811 | -0.252 | -0.163 | -0.335 |
|
-N+P: Nitrogen starved in the presence of P-factor -N-P: Nitrogen starved in the absence of P-factor |