rps1601 rps16-1
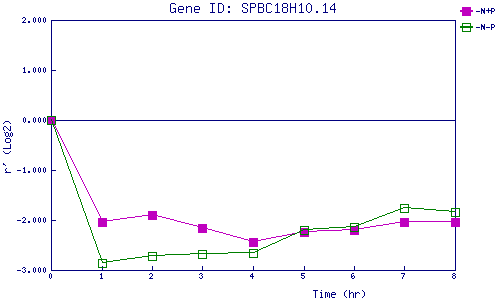
| 0 | 1 | 2 | 3 | 4 | 5 | 6 | 7 | 8 | |
| -N+P | 0.000 | -2.049 | -1.892 | -2.159 | -2.441 | -2.248 | -2.193 | -2.042 | -2.038 |
| -N-P | 0.000 | -2.854 | -2.727 | -2.672 | -2.653 | -2.203 | -2.138 | -1.751 | -1.835 |
|
-N+P: Nitrogen starved in the presence of P-factor -N-P: Nitrogen starved in the absence of P-factor |