| 0 | 1 | 2 | 3 | 4 | 5 | 6 | 7 | 8 | |
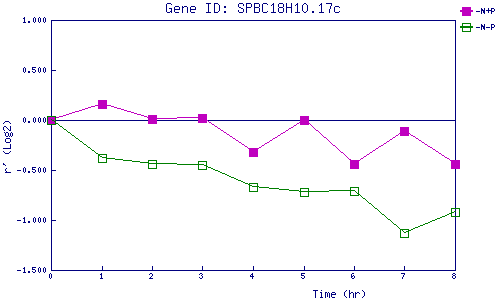
| -N+P | 0.000 | 0.159 | 0.012 | 0.016 | -0.325 | -0.002 | -0.440 | -0.107 | -0.444 |
| -N-P | 0.000 | -0.376 | -0.436 | -0.447 | -0.674 | -0.723 | -0.709 | -1.126 | -0.918 |
|
-N+P: Nitrogen starved in the presence of P-factor -N-P: Nitrogen starved in the absence of P-factor |