| 0 | 1 | 2 | 3 | 4 | 5 | 6 | 7 | 8 | |
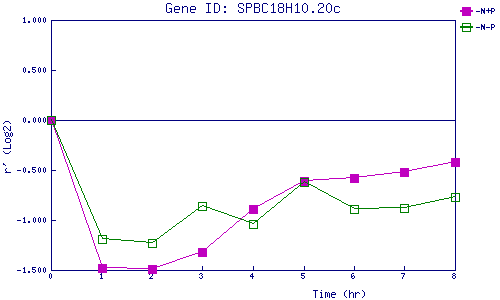
| -N+P | 0.000 | -1.475 | -1.491 | -1.321 | -0.893 | -0.607 | -0.582 | -0.516 | -0.425 |
| -N-P | 0.000 | -1.194 | -1.231 | -0.859 | -1.045 | -0.625 | -0.893 | -0.883 | -0.773 |
|
-N+P: Nitrogen starved in the presence of P-factor -N-P: Nitrogen starved in the absence of P-factor |