rad60
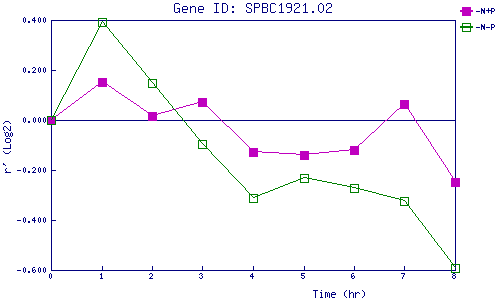
| 0 | 1 | 2 | 3 | 4 | 5 | 6 | 7 | 8 | |
| -N+P | 0.000 | 0.152 | 0.016 | 0.070 | -0.129 | -0.139 | -0.119 | 0.063 | -0.249 |
| -N-P | 0.000 | 0.394 | 0.149 | -0.094 | -0.311 | -0.230 | -0.270 | -0.324 | -0.594 |
|
-N+P: Nitrogen starved in the presence of P-factor -N-P: Nitrogen starved in the absence of P-factor |