mex67
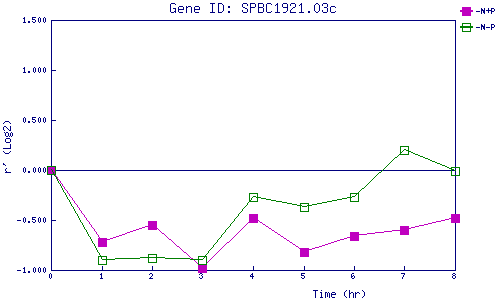
| 0 | 1 | 2 | 3 | 4 | 5 | 6 | 7 | 8 | |
| -N+P | 0.000 | -0.718 | -0.547 | -0.975 | -0.482 | -0.818 | -0.660 | -0.605 | -0.480 |
| -N-P | 0.000 | -0.904 | -0.884 | -0.902 | -0.270 | -0.372 | -0.270 | 0.196 | -0.011 |
|
-N+P: Nitrogen starved in the presence of P-factor -N-P: Nitrogen starved in the absence of P-factor |