pmt1
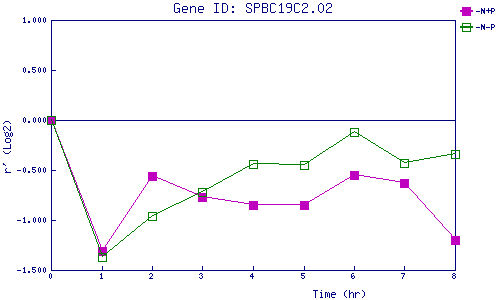
| 0 | 1 | 2 | 3 | 4 | 5 | 6 | 7 | 8 | |
| -N+P | 0.000 | -1.312 | -0.565 | -0.770 | -0.852 | -0.852 | -0.554 | -0.629 | -1.197 |
| -N-P | 0.000 | -1.374 | -0.958 | -0.717 | -0.441 | -0.450 | -0.116 | -0.433 | -0.345 |
|
-N+P: Nitrogen starved in the presence of P-factor -N-P: Nitrogen starved in the absence of P-factor |