rpc10 rpb12
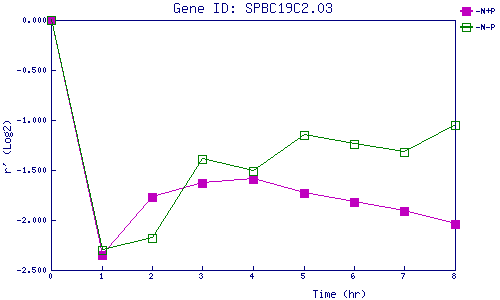
| 0 | 1 | 2 | 3 | 4 | 5 | 6 | 7 | 8 | |
| -N+P | 0.000 | -2.351 | -1.768 | -1.629 | -1.591 | -1.732 | -1.823 | -1.910 | -2.045 |
| -N-P | 0.000 | -2.303 | -2.184 | -1.390 | -1.510 | -1.149 | -1.236 | -1.322 | -1.054 |
|
-N+P: Nitrogen starved in the presence of P-factor -N-P: Nitrogen starved in the absence of P-factor |