reserved_name_ubp11
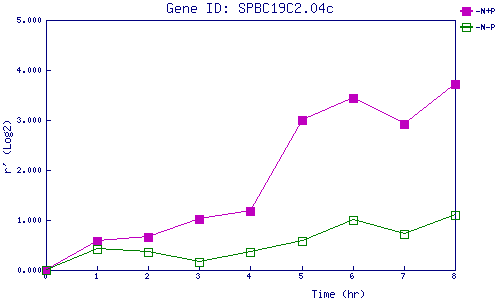
| 0 | 1 | 2 | 3 | 4 | 5 | 6 | 7 | 8 | |
| -N+P | 0.000 | 0.585 | 0.668 | 1.024 | 1.185 | 3.009 | 3.435 | 2.926 | 3.720 |
| -N-P | 0.000 | 0.429 | 0.351 | 0.151 | 0.351 | 0.574 | 0.991 | 0.715 | 1.103 |
|
-N+P: Nitrogen starved in the presence of P-factor -N-P: Nitrogen starved in the absence of P-factor |