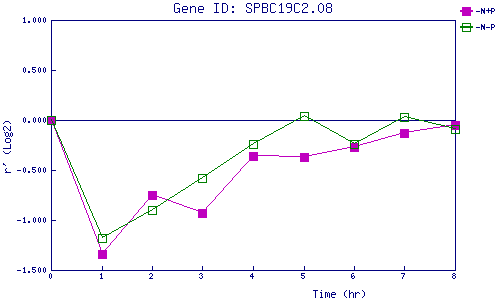
| 0 | 1 | 2 | 3 | 4 | 5 | 6 | 7 | 8 | |
| -N+P | 0.000 | -1.342 | -0.746 | -0.930 | -0.362 | -0.368 | -0.267 | -0.129 | -0.051 |
| -N-P | 0.000 | -1.185 | -0.898 | -0.583 | -0.239 | 0.042 | -0.238 | 0.026 | -0.094 |
|
-N+P: Nitrogen starved in the presence of P-factor -N-P: Nitrogen starved in the absence of P-factor |