| 0 | 1 | 2 | 3 | 4 | 5 | 6 | 7 | 8 | |
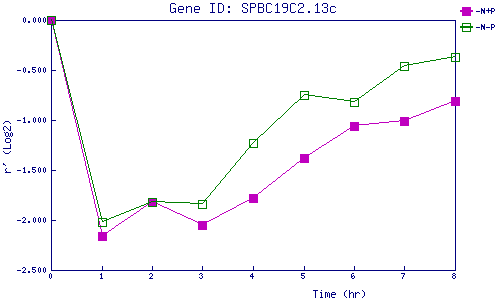
| -N+P | 0.000 | -2.156 | -1.825 | -2.052 | -1.779 | -1.382 | -1.056 | -1.007 | -0.813 |
| -N-P | 0.000 | -2.017 | -1.820 | -1.844 | -1.228 | -0.752 | -0.820 | -0.463 | -0.374 |
|
-N+P: Nitrogen starved in the presence of P-factor -N-P: Nitrogen starved in the absence of P-factor |