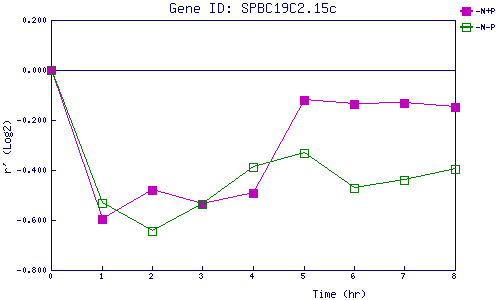
| 0 | 1 | 2 | 3 | 4 | 5 | 6 | 7 | 8 | |
| -N+P | 0.000 | -0.597 | -0.479 | -0.536 | -0.493 | -0.122 | -0.135 | -0.131 | -0.148 |
| -N-P | 0.000 | -0.531 | -0.645 | -0.535 | -0.388 | -0.333 | -0.470 | -0.438 | -0.397 |
|
-N+P: Nitrogen starved in the presence of P-factor -N-P: Nitrogen starved in the absence of P-factor |