| 0 | 1 | 2 | 3 | 4 | 5 | 6 | 7 | 8 | |
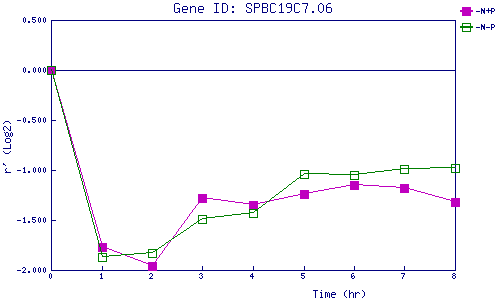
| -N+P | 0.000 | -1.773 | -1.961 | -1.285 | -1.353 | -1.242 | -1.152 | -1.185 | -1.321 |
| -N-P | 0.000 | -1.872 | -1.827 | -1.491 | -1.432 | -1.038 | -1.052 | -0.988 | -0.983 |
|
-N+P: Nitrogen starved in the presence of P-factor -N-P: Nitrogen starved in the absence of P-factor |