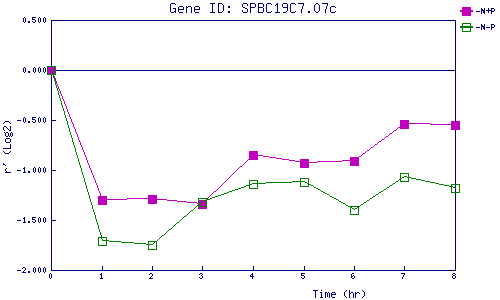
| 0 | 1 | 2 | 3 | 4 | 5 | 6 | 7 | 8 | |
| -N+P | 0.000 | -1.301 | -1.290 | -1.345 | -0.853 | -0.932 | -0.913 | -0.538 | -0.549 |
| -N-P | 0.000 | -1.714 | -1.750 | -1.325 | -1.141 | -1.124 | -1.399 | -1.071 | -1.179 |
|
-N+P: Nitrogen starved in the presence of P-factor -N-P: Nitrogen starved in the absence of P-factor |