| 0 | 1 | 2 | 3 | 4 | 5 | 6 | 7 | 8 | |
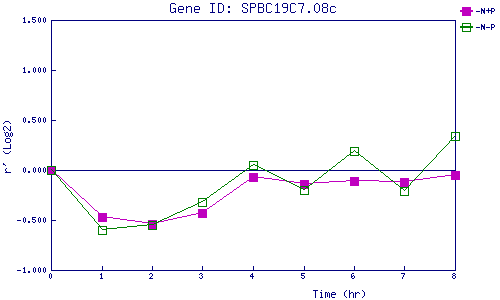
| -N+P | 0.000 | -0.472 | -0.543 | -0.433 | -0.068 | -0.137 | -0.113 | -0.120 | -0.053 |
| -N-P | 0.000 | -0.602 | -0.552 | -0.322 | 0.051 | -0.197 | 0.189 | -0.211 | 0.345 |
|
-N+P: Nitrogen starved in the presence of P-factor -N-P: Nitrogen starved in the absence of P-factor |
