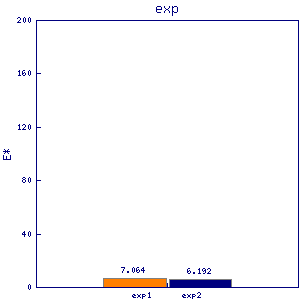
uvde uve1
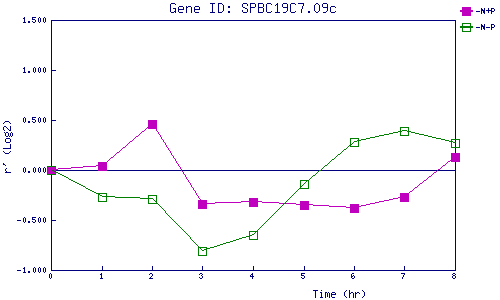
| 0 | 1 | 2 | 3 | 4 | 5 | 6 | 7 | 8 | |
| -N+P | 0.000 | 0.035 | 0.455 | -0.344 | -0.325 | -0.346 | -0.375 | -0.274 | 0.128 |
| -N-P | 0.000 | -0.274 | -0.293 | -0.811 | -0.654 | -0.141 | 0.283 | 0.390 | 0.266 |
|
-N+P: Nitrogen starved in the presence of P-factor -N-P: Nitrogen starved in the absence of P-factor |