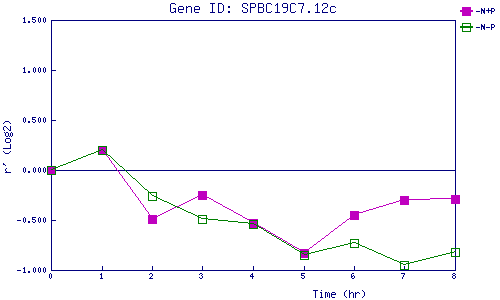
| 0 | 1 | 2 | 3 | 4 | 5 | 6 | 7 | 8 | |
| -N+P | 0.000 | 0.205 | -0.487 | -0.249 | -0.529 | -0.828 | -0.447 | -0.305 | -0.289 |
| -N-P | 0.000 | 0.201 | -0.257 | -0.488 | -0.536 | -0.848 | -0.731 | -0.953 | -0.819 |
|
-N+P: Nitrogen starved in the presence of P-factor -N-P: Nitrogen starved in the absence of P-factor |