| 0 | 1 | 2 | 3 | 4 | 5 | 6 | 7 | 8 | |
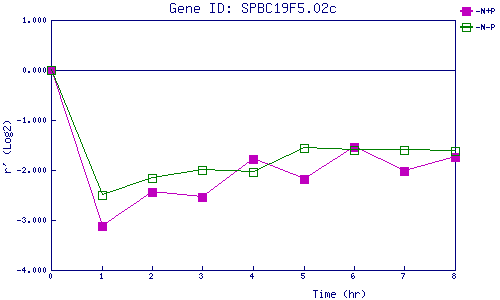
| -N+P | 0.000 | -3.113 | -2.450 | -2.544 | -1.776 | -2.182 | -1.541 | -2.023 | -1.745 |
| -N-P | 0.000 | -2.503 | -2.166 | -2.010 | -2.045 | -1.557 | -1.603 | -1.602 | -1.618 |
|
-N+P: Nitrogen starved in the presence of P-factor -N-P: Nitrogen starved in the absence of P-factor |