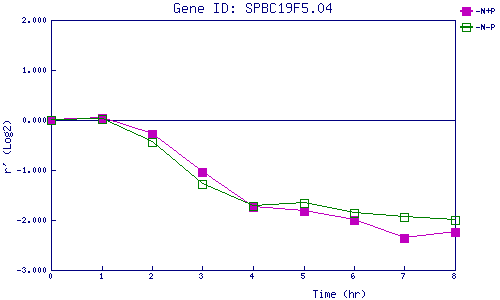
| 0 | 1 | 2 | 3 | 4 | 5 | 6 | 7 | 8 | |
| -N+P | 0.000 | 0.040 | -0.279 | -1.044 | -1.736 | -1.815 | -2.009 | -2.366 | -2.235 |
| -N-P | 0.000 | 0.021 | -0.432 | -1.290 | -1.722 | -1.668 | -1.859 | -1.934 | -1.999 |
|
-N+P: Nitrogen starved in the presence of P-factor -N-P: Nitrogen starved in the absence of P-factor |