| 0 | 1 | 2 | 3 | 4 | 5 | 6 | 7 | 8 | |
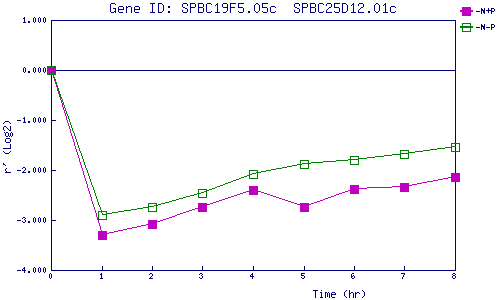
| -N+P | 0.000 | -3.308 | -3.079 | -2.738 | -2.390 | -2.733 | -2.378 | -2.335 | -2.141 |
| -N-P | 0.000 | -2.902 | -2.738 | -2.460 | -2.077 | -1.872 | -1.802 | -1.681 | -1.545 |
|
-N+P: Nitrogen starved in the presence of P-factor -N-P: Nitrogen starved in the absence of P-factor |